
The Seven Numbers a Business Owner Should See Every Week
Most marketing reports open with impressions and clicks. An owner needs seven numbers that connect spend to cash, and a way to see them in under five minutes.
By Ads Ninza · Published 22 September 2026 · 5 min read
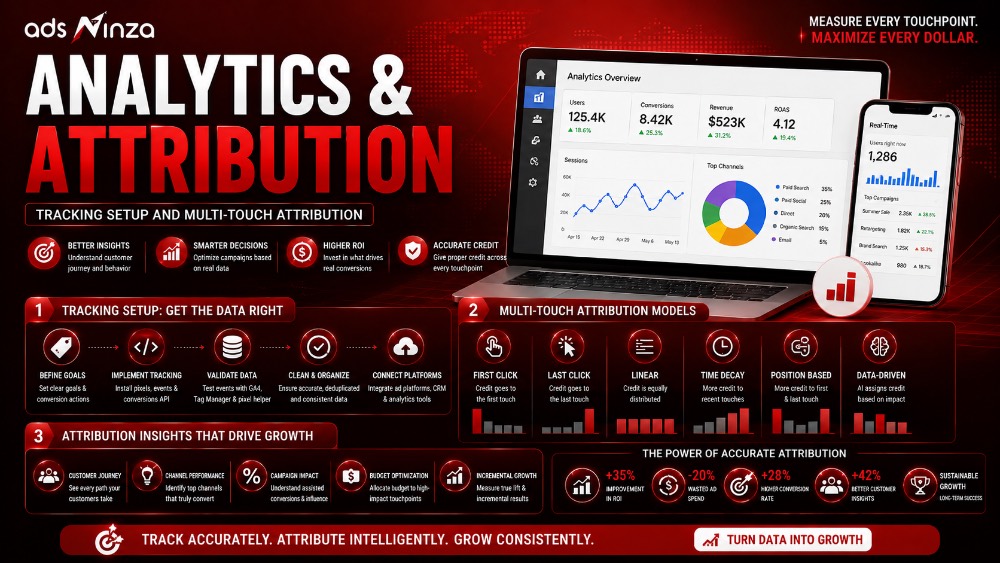
The seven numbers
1. Marketing spend. Total, and by channel. Media plus fees.
2. Leads. All enquiries, by source.
3. Qualified leads. Enquiries that meet your qualification rules. The most important number most businesses do not track.
4. Cost per qualified lead. Spend divided by qualified leads, by channel. This is the number to compare channels on.
5. Sales from new customers. Count and value, with the source where known.
6. Revenue per rupee or dollar of marketing. New customer revenue divided by spend. Crude, but a quick health check.
7. Cash. Cash in the bank and money owed to you. Growth that drains cash is a problem the other numbers do not show.
What to leave out of the owner view
Impressions, reach, clicks, click-through rate, cost per click, engagement, followers and Quality Score are useful to the person running campaigns. They are diagnostic. They tell a specialist where to look when a business number moves.
They are not the business result. A report that leads with them shifts the conversation to activity. If the first page of your agency report is impressions, ask for qualified leads and cost per qualified lead instead. We wrote about this in how to choose an agency.
How to build it from tools you already have
Spend comes from Google Ads, Meta and any other platform, pulled automatically into Looker Studio or a spreadsheet.
Leads and source come from your CRM or form tool, provided each lead records where it came from automatically.
Qualified leads and sales come from your CRM, provided the sales team updates status. This is usually the weak point. A weekly five-minute pipeline review fixes it.
Cash comes from your accounting system.
A single page in Looker Studio, or a spreadsheet updated automatically, covers all seven. The setup takes a few days. The hard part is keeping the lead status accurate, which is a process issue, not a tool issue.
Reading it: weekly trends and warning signs
Look at this week against the last four weeks, not against last month. Weekly trends show problems while they are still small.
Leads up, qualified leads flat. Lead quality is falling. Check recent changes to ads, forms or targeting.
Qualified leads steady, sales down. Follow-up or sales process issue. Check response times.
Spend up, qualified leads flat. Diminishing returns or waste. Check search terms and new campaigns.
Sales up, cash down. You may be growing faster than you get paid. Check payment terms and receivables.
The detail on making sure the numbers are accurate in the first place is on our tracking and signal page.
Market notes
For businesses selling in several markets, split the dashboard by country. Costs, close rates and deal values in the USA, UK, UAE, Canada and India differ enough to make a combined view misleading. Report each in its own currency, with a converted total for the overview.
In markets with strict consent rules, such as the UK, platform-reported conversions will be lower than actual leads. Use CRM numbers for the owner view and platform numbers only for optimisation.
Frequently asked questions
What marketing metrics should a business owner track?
Seven numbers cover most businesses: marketing spend, leads, qualified leads, cost per qualified lead, sales from new customers, new customer revenue per unit of spend, and cash position. Specialist metrics such as clicks and impressions belong in the campaign manager view.
What is a qualified lead?
An enquiry that meets your rules for a potential customer, such as budget, need, timeline and location. Tracking qualified leads separately from all leads shows whether marketing is bringing the right people.
How often should I review marketing numbers?
Weekly for the owner view, compared with the previous four weeks. Monthly reviews catch problems after they have already cost a month of results.
What should an agency report include?
It should lead with business outcomes: qualified leads, cost per qualified lead, sales and revenue where tracked, and spend. Diagnostic metrics such as clicks and impressions can follow. A report that leads with impressions is focused on activity rather than results.
What tools can I use for a marketing dashboard?
Looker Studio, which is free, or a spreadsheet can pull data from Google Ads, Meta, GA4 and many CRMs. Accounting software supplies cash figures. The tools matter less than keeping lead status accurate.
Why do my ad platform numbers not match my CRM?
Platforms count conversions differently, may double count, model some conversions and miss others because of consent and browser restrictions. Use CRM numbers for business decisions and platform numbers for campaign optimisation.
What is a good cost per qualified lead?
One that fits your economics: below your acceptable customer acquisition cost multiplied by your qualified-lead-to-customer rate. It varies widely by industry and market.
Should I track return on ad spend?
For e-commerce, yes, alongside contribution margin. For lead generation, revenue per unit of spend and cost per qualified lead are usually more useful because sales happen later and offline.
How do I get my sales team to update lead status?
Make the CRM the only place leads live, keep required fields few, and review the pipeline together every week. When the team sees the numbers used in decisions, updating becomes routine.
How do we start with Ads Ninza?
Apply through the form on this page. On a paid discovery call, INR 499 in India and $9 elsewhere, we look at what you track today and what is missing. Services start at INR 35,000 per month in India and $500 per month outside India.